> For the complete documentation index, see [llms.txt](https://docs.tradeeasy.io/llms.txt). Markdown versions of documentation pages are available by appending `.md` to page URLs; this page is available as [Markdown](https://docs.tradeeasy.io/our-toolkit/quickstart.md).
# Our Signals
How to use TradeEasy signals and why they are the best.
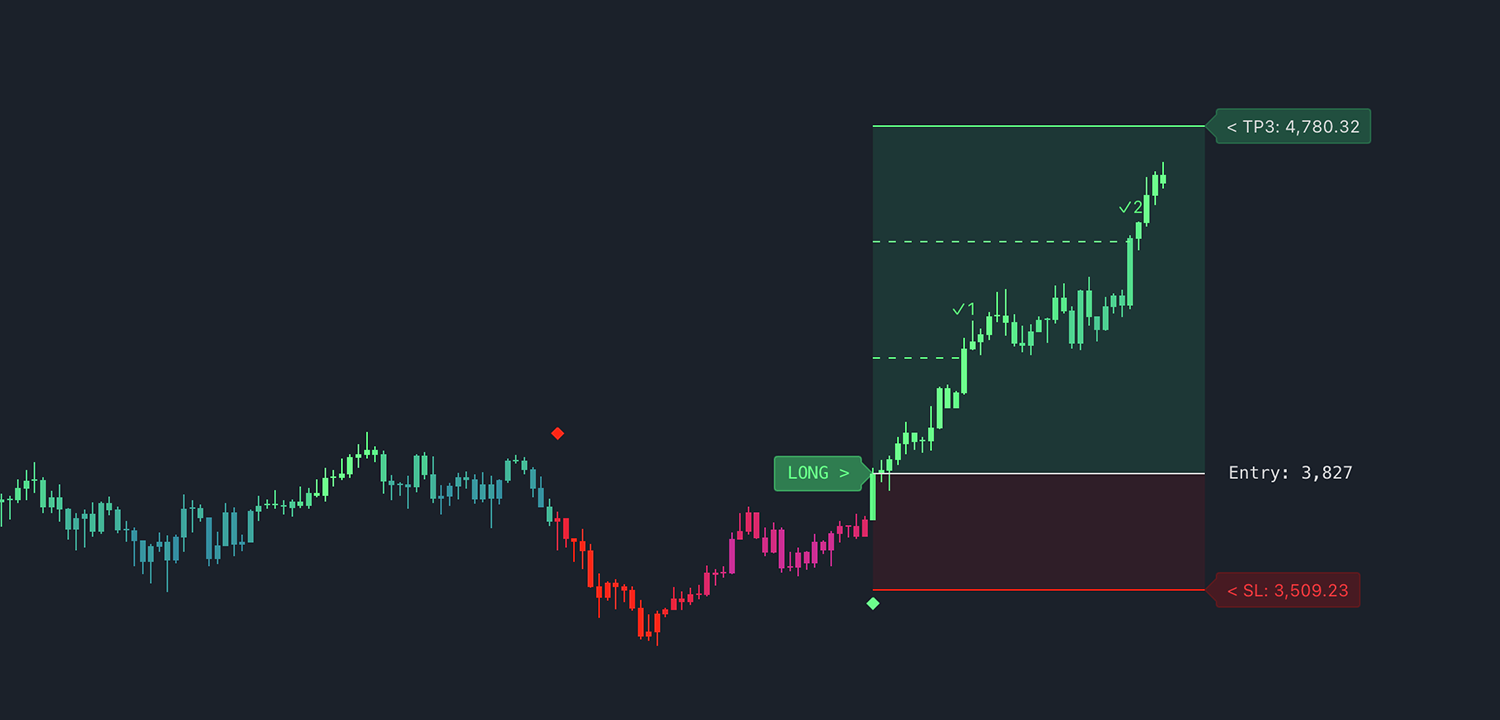
Long Signal with TP and SL Levels
The **Trend Flow Toolkit \[TradeEasy]** provides automated entry signals, stop-loss (SL), and multi-level take-profit (TP) zones. \
It is designed for traders who want to follow **clear trend signals** with minimal guesswork.
{% hint style="success" %}
Our signals are the SIMPLEST to understand and follow
{% endhint %}
### Signal Type
Within TradeEasy we produce two types of signals; long and short.
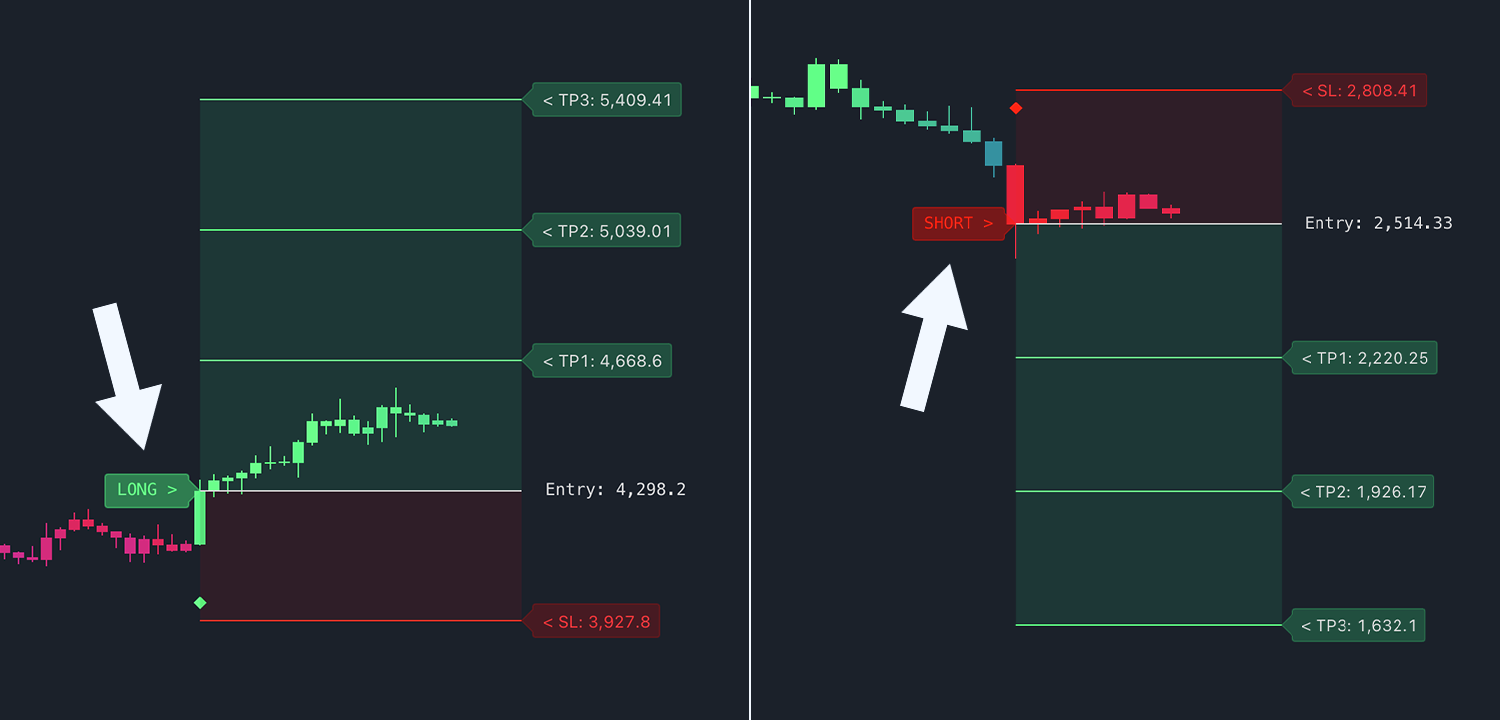
* **LONG**: Green label appears when bullish trend or reversal is detected.
* **SHORT**: Red label appears for bearish entries or reversion setups.
Long Signal (Left) | Short Signal (Right)
### Take Profits
Each signal comes with:
* **Entry Price** — Displayed next to the label
* **Stop Loss (SL)** — Red box beneath (LONG) or above (SHORT) entry
* **Take Profits (TP1, TP2, TP3)** — Green boxes above (LONG) or below (SHORT) entry
> Example:\
> **LONG** at 4560.26 - we buy here.\
> \
> SL: 4494.45 - we set our stop loss at this level \
> \
> TP1: 4626.07, TP2: 4691.88, TP3: 4757.69 - all our take profits ready to go!
Take profit 1 or "TP1" is the closest to the price and therefore the most likely to get hit and TP2 and TP3 serve as highest reward targets. All trades are also set up with favourable risk:reward ratios. \
\
When a TP is hit a checkmark (✓) is produced showing we've made profit!
### Stop Loss
Our stop loss zone is highlighted in red and is always calculated to avoid being hit. By analysing liquidity and volume data we can avoid possible fakeouts to ensure you stay in your trade longer.
When a stop loss is hit we exit our trade and we wait for the next! Losing is a natural part of trading however with TP3 being hit and our stop losses we only need to win 25% of our trades to break even! That's the magic of a good trade setup.
### Historical Signals
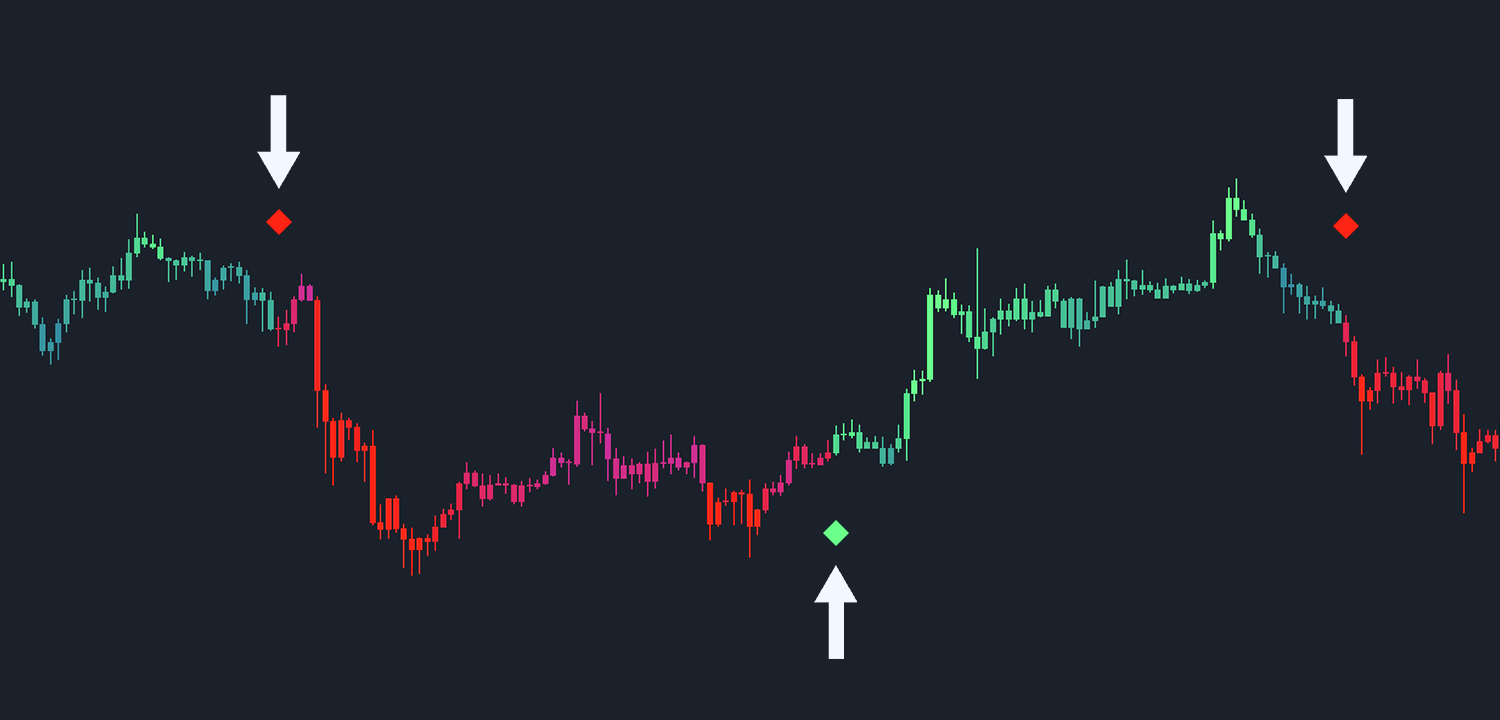
* **Colored dots** (red, green, blue) on past candles are older signals.
* These help visually track where previous signals occurred.
* Only **latest signal** will produce an active TP/SL structure.
Historical Signals
\
---
# Agent Instructions
This documentation is published with GitBook. GitBook is the documentation platform designed so that both humans and AI agents can read, navigate, and reason over technical content effectively. Learn more at gitbook.com.
## Querying This Documentation
If you need additional information that is not directly available in this page, you can query the documentation dynamically by asking a question.
Perform an HTTP GET request on the current page URL with the `ask` query parameter, and the optional `goal` query parameter:
```
GET https://docs.tradeeasy.io/our-toolkit/quickstart.md?ask=&goal=
```
`ask` is the immediate question: it should be specific, self-contained, and written in natural language.
`goal` is optional and describes the broader end goal you are ultimately trying to accomplish on behalf of the user. GitBook uses it to tailor the answer towards what is most useful for that goal.
The response will contain a direct answer to the question and relevant excerpts and sources from the documentation.
Use this mechanism when the answer is not explicitly present in the current page, you need clarification or additional context, or you want to retrieve related documentation sections.